About Advanced Data Export
Drive adoption across your organization with Advanced Data Export. Generate user-level and location-based granular reports to analyze Platform usage. Develop and implement custom adoption strategies per team or location, optimizing work processes and increasing engagement.
Prerequisites
- Access to the Metrics Dashboard of your organization
- DataSnipper Elevate Package
- DataSnipper Version 5.1 or later
Step-by-step Guide
1. To use Advance Reporting first open your DataSnipper usage dashboard.
2. Next, select the period range of data you want to report out. This could be predefined, or you select it yourself.
3. Click on the "Advanced Data Export" button located at the top of your dashboard next to your data range.

4. An Excel workbook will start downloading to your local download folder.
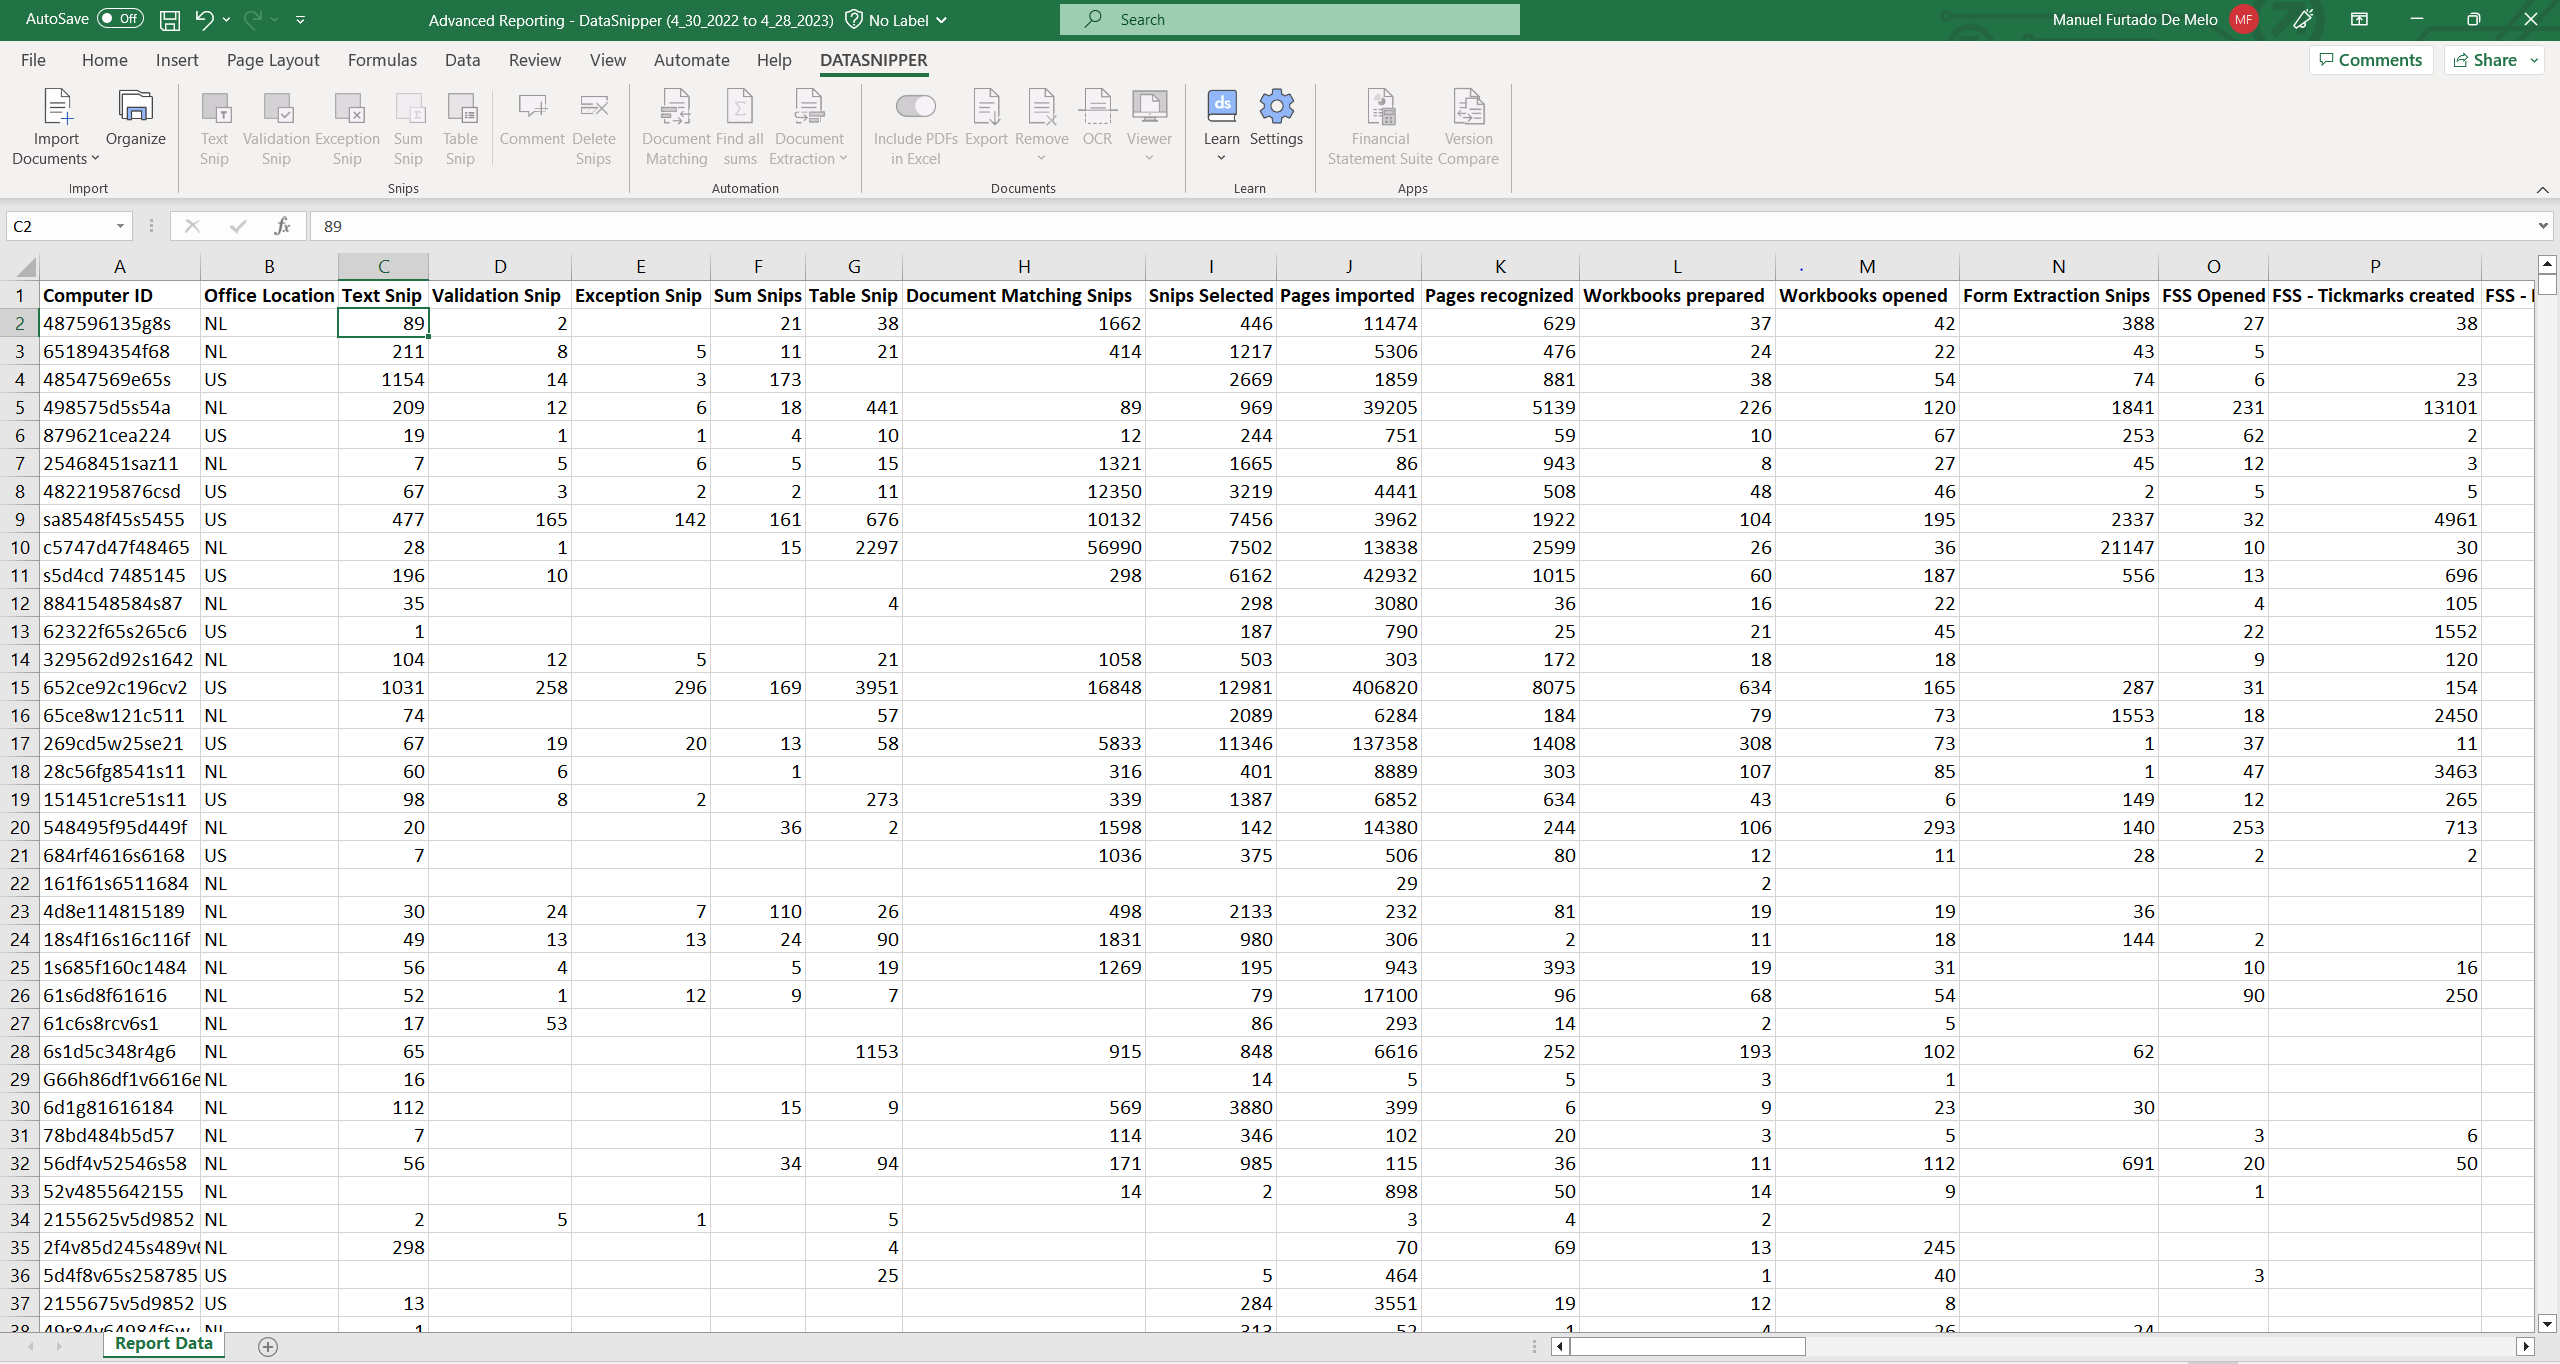
5. As you open your report in Excel, you'll need to enable all content (inclding macros) in order to see the comprehensive data in the workbook. This report will now show all the usage data, in a fully anonymous form, where you can proceed to map the hashes following the instructions in the file.
If macros are blocked when opening the usage report, follow these steps:
-
-
Right-click on the downloaded file and select Properties.
-
In the Properties window, check the Unblock option at the bottom.
-1.png?width=415&height=541&name=image%20(13)-1.png)
-
c. Click Apply and then OK.
Open the file again and follow the Instructions tab for further guidance.
Detailed list of tracked data in Advanced Data Export
- Text Snip
- Validation Snip
- Exception Snip
- Sum Snips
- Table Snip
- Document Matching Snips
- Find All Sums Snips
- Snips Selected
- Workbooks prepared
- Workbooks opened
- Document imported
- Pages imported
- Pages recognized
- Form Extraction Snips
- Invoice Extraction Snip
- Invoice Extraction Page
- Receipt Extraction Snip
- Receipt Extraction Page
- Contract Extraction Snip
- Contract Extraction Page
- Business Card Snip
- Business Card Page
- Identity Document Snip
- Identity Document Page
- Health Insurance Card US Snip
- Health Insurance Card US Page
- US Tax W-2 Snip
- US Tax W-2 Page
- US Tax 1098 Snip
- US Tax 1098 Page
- US Tax 1098-E Snip
- US Tax 1098-E Page
- US Tax 1098-T Snip
- US Tax 1098-T Page
- FSS Opened
- FSS Exported
- FSS - Tickmarks created
- FSS - Manual Tickmarks Placed (IC)
- FSS - Manual Tickmarks Placed (PY)
- FSS - Manual Tickmarks Placed (MA)
- FSS - Auto Tickmarks Correct Created (IC)
- FSS - Auto Tickmarks Correct Created (PY)
- FSS - Auto Tickmarks Correct Created (MA)
- FSS - Auto Tickmarks Correct Changed (IC)
- FSS - Auto Tickmarks Correct Changed (PY)
- FSS - Auto Tickmarks Correct Changed (MA)
- FSS - Auto Tickmarks Correct Deleted (IC)
- FSS - Auto Tickmarks Correct Deleted (PY)
- FSS - Auto Tickmarks Correct Deleted (MA)
- FSS - Auto Tickmarks Finding Created (IC)
- FSS - Auto Tickmarks Finding Created (PY)
- FSS - Auto Tickmarks Finding Created (MA)
- FSS - Auto Tickmarks Finding Changed (IC)
- FSS - Auto Tickmarks Finding Changed (PY)
- FSS - Auto Tickmarks Finding Changed (MA)
- FSS - Auto Tickmarks Finding Deleted (IC)
- FSS - Auto Tickmarks Finding Deleted (PY)
- FSS - Auto Tickmarks Finding Deleted (MA)